
 Get Support
 admin
Picture the quarterly business review. The numbers are up on screen, the CFO is halfway down the P&L, and then the question lands: “Our people cost is nearly half our operating budget. So why are these roles still open after six weeks, and what is each hire actually costing us?”
If you’re the CHRO in that room, this is the moment. You either have the number, or you have a folder full of reports that count how busy your team has been: job posts made, CVs screened, interviews scheduled, none of which answer what was asked.
That gap is the whole problem with most HR reporting in India. It measures activity, not outcomes. And boards have stopped accepting activity as proof that the people function is working.
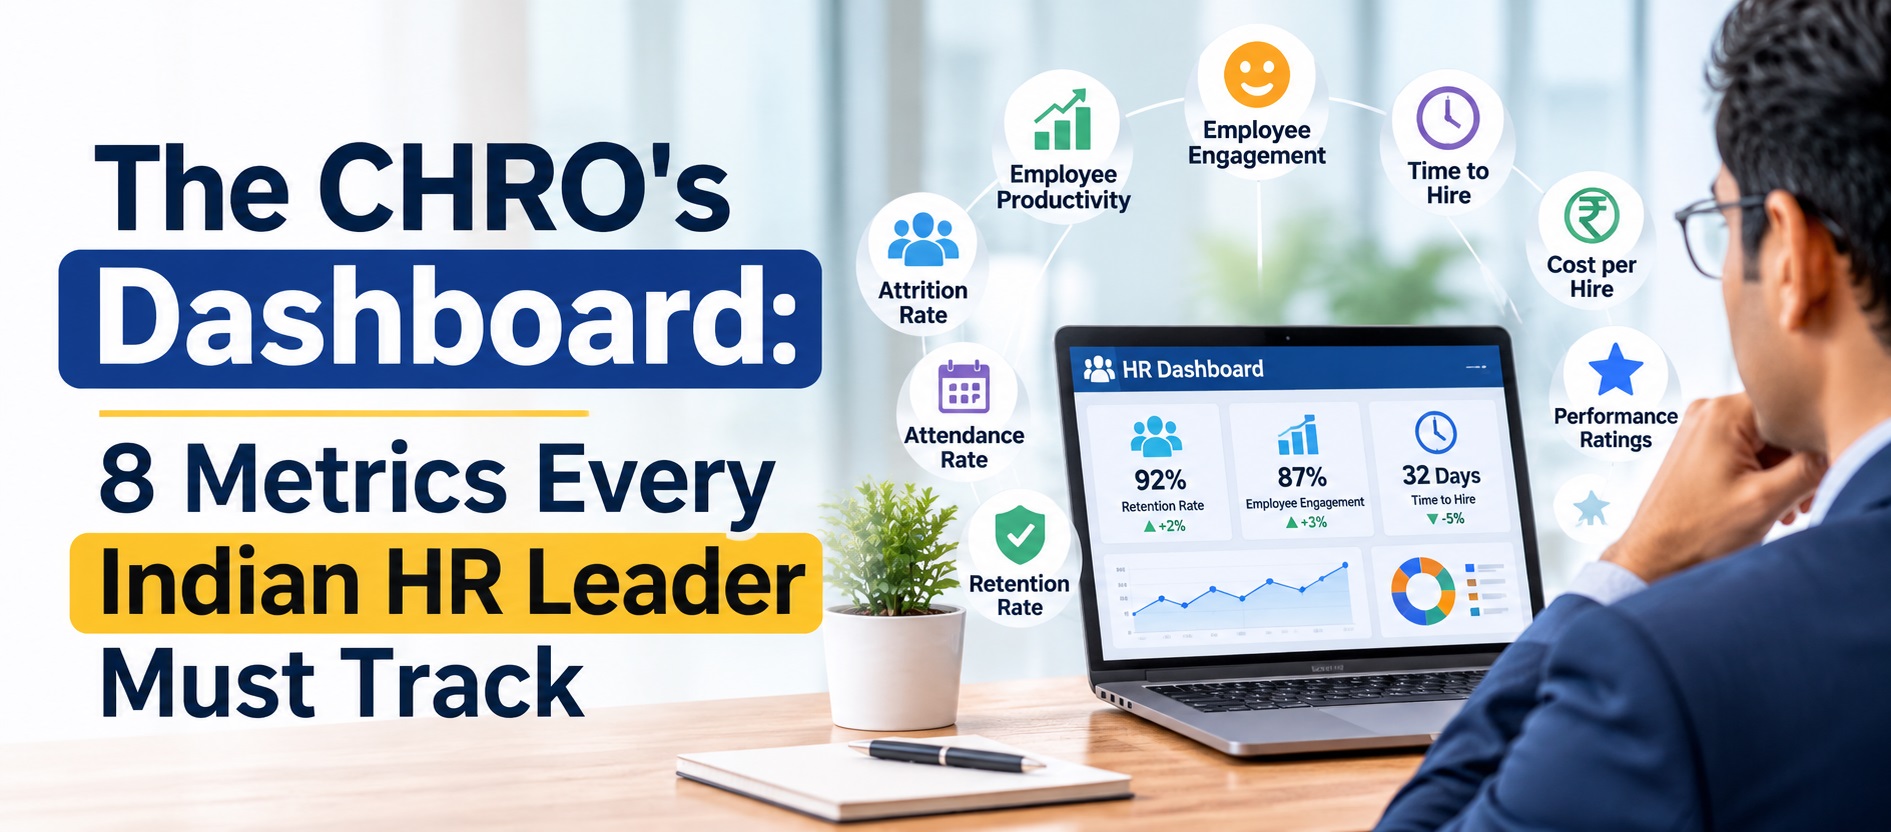
A real CHRO dashboard isn’t a wall of forty charts. It’s a tight set of numbers that tell you, at a glance, whether your talent strategy is holding up. Get the right ones on one screen and HR stops being the department that asks for budget; it becomes the function that can defend it.
Here are the eight HR metrics in India that earn their place on that screen, why each one matters, and what “good” actually looks like in 2026.
First, what makes a metric dashboard-worthy?
Before the list, a quick filter, because tracking the wrong things well is just as dangerous as tracking nothing.
Leading beats lagging. Some numbers tell you what already happened (attrition). Others warn you what’s coming (engagement, absenteeism). A good dashboard carries both, so you’re not only reading the past.
Benchmark against your sector, not the nation. India’s headline attrition means very little on its own. A 15% rate is excellent for a Bengaluru tech firm and mediocre for a Mumbai BFSI player. Always compare against roles like yours.
Fewer numbers, tracked honestly. Eight metrics you actually act on will beat thirty that nobody opens. The point isn’t the dashboard. It’s the decision it triggers on Monday.
With that lens, let’s get into it.
1. Attrition rate: The version that actually matters
Everyone tracks attrition. Almost nobody tracks it usefully.
The headline number — total people who left over total headcount — hides more than it reveals. What you really want are two sharper cuts: regrettable attrition (the people you’d have fought to keep) and first-year attrition (which quietly grades your hiring and onboarding).
The context matters here. Aon’s survey of over 1,060 companies puts India’s overall attrition easing to around 13–14% in 2026, down from roughly 17% in 2025. But the average is almost useless: e-commerce runs near 29%, IT around 25%, BFSI near 14%, and manufacturing closer to 9%.
Here’s the trap. A company proudly reports “12% attrition” while quietly losing its best engineers and keeping its weakest performers. The blended number looks calm. The talent bleed underneath is anything but.
2. Time to hire: And the gap nobody counts
Time to hire measures the days from an approved requisition to an accepted offer. It’s the clearest read on how much friction sits inside your recruitment engine.
In India, the average now runs roughly 35 to 45 days, stretching to two, three, even four months for senior and niche roles. Retail and e-commerce move fastest, often filling in a couple of weeks. The best-in-class benchmark is under ten days.
One honest caveat: India has no clean national benchmark that splits this cleanly by sector and level. So treat the number as a gut-check on your own pipeline over time, not as gospel.
And then there’s the gap nobody puts on a dashboard — the wait after “yes.” Notice periods here run 30 to 90 days, and about one in three IT roles carries a full 90-day notice. So a candidate can accept in week one and still not sit at their desk for three months.
Track that “offer-to-start” window as its own number. Otherwise a role you count as “filled” leaves a team short-staffed and burning out for a quarter, and your capacity planning quietly falls apart.
3. Cost per hire: The number most companies get wrong
Cost per hire tells you what it actually costs to bring one person on board — every rupee from the first job post to the signed offer, divided by the number of hires.
In India, that typically lands between ₹30,000 and ₹70,000, running from around ₹35,000 for entry-level roles to well over ₹2.5 lakh for executives. Tier-1 cities cost 30 to 50% more than smaller ones.
The problem is that most companies calculate it wrong, or don’t calculate it at all. They count the agency invoice and the job-board subscription, then quietly ignore the recruiter’s salary, the hiring manager’s hours, and the software running underneath. The result is a reassuringly low number that tells you almost nothing.
Add the internal time back in and the real figure often doubles or triples. That matters, because people costs make up 30 to 60% of operating expenses for most Indian companies — this is a line the CFO will absolutely want defended.
Consider the firm celebrating a “cheap” cost per hire while ignoring that a quarter of those hires quit within a year. They weren’t saving money. They were paying to fill the same seat twice.
4. Offer acceptance rate: Your live employer-brand signal
Offer acceptance rate is simple: of the offers you make, how many turn into a yes? What it tells you is anything but simple.
It’s a real-time read on how competitive you are. When acceptances start slipping, the market is telling you something — your pay is off, your process is too slow, or your reputation isn’t pulling its weight.
The Indian hiring funnel makes this vivid. Referrals convert at 20 to 30%, while job boards convert at just 1 to 3%. A striking share of drop-offs happen right between the final interview and the offer. And with 82% of Indian companies reporting they can’t find the skills they need, good candidates rarely wait around.
Here’s a scenario every talent head knows. The exit reason on paper says “better opportunity.” The real reason was that your offer took three weeks to approve while a competitor moved in 48 hours.
Ghosting runs both ways too — candidates go quiet after saying yes, and employers go quiet after final rounds. Both cost you, and both show up later in reviews that shape what the next candidate thinks before they even apply.
5. Absenteeism and attendance — the quiet productivity leak
Absenteeism is the share of scheduled workdays lost to unplanned absence — not your approved leave, but the no-shows and last-minute gaps that disrupt operations.
For desk-bound teams it’s easy to overlook. For field forces, shift workers, and multi-site operations, it’s one of the biggest hidden drains on productivity you have — and an early warning sign of stress and disengagement long before anyone resigns.
In India, absenteeism typically runs between 3.5% and 5% of workdays, higher in manufacturing (often 7%+) and lower in IT and services (around 2–3%). Under 3% is healthy; cross 5% and it’s worth investigating why. Deloitte has estimated that unplanned absence costs India Inc thousands of crores every year once you factor in overtime, cover, and lost output.
The catch is that most companies can’t measure it accurately in the first place. Attendance logged on paper or trust alone isn’t data — it’s guesswork. This is exactly where reliable attendance capture (biometric, geo-tagged, or mobile for field staff) turns a fuzzy metric into a number you can act on.
6. Employee engagement and eNPS — your best early warning
Engagement measures how connected and committed your people feel. The simplest way to track it is eNPS — would your employees recommend working here? — scored from their answers and turned into a single number you can trend over time.
Why it belongs on the dashboard: it’s a leading indicator. Low engagement today becomes attrition and flat productivity two quarters from now.
The India picture is genuinely mixed. Gallup finds India’s engaged employees at roughly a third of the workforce — higher than the global average of about 20% — yet nearly half say they’re watching for or actively seeking a new job. And Gallup’s most repeated finding still holds: managers account for around 70% of the variance in team engagement. Recently, manager engagement across South Asia fell by eight points, the steepest drop of any region.
That’s not a soft, feel-good metric. Gallup’s data ties high engagement to roughly 21% higher profitability and around 20% better performance. When one team’s engagement quietly slides while the one beside it holds steady, you’ve usually found your next attrition problem two quarters early.
7. Revenue per employee — HR in the CFO’s language
This one takes your business output and divides it by headcount. It’s the metric that translates people decisions into the language your CFO actually speaks.
Its job is to keep everyone honest about whether you’re scaling efficiently or just adding bodies. When people costs are 30 to 60% of operating expenses, the question isn’t only “can we hire more?” — it’s “is each person we add actually adding value?”
You don’t need a precise industry figure to make this useful; it varies enormously by sector, and IT services firms famously live and die by it. What matters is the trend. Two teams with identical headcount can produce wildly different output, and this number forces that conversation into the open.
Used well, it’s the quiet antidote to headcount bloat. The reflex answer to any bottleneck is “let’s hire.” Revenue per employee asks whether the last round of hiring actually moved the number — before you sign off on the next.
8. Internal mobility & performance — growing or just replacing?
The last one is really two connected questions. How many roles do you fill from within? And when you look at your performance ratings, how do they actually spread?
Internal mobility is one of the cheapest retention levers you own. Filling a role from inside costs a fraction of an external hire, comes with someone who already knows the business, and sends a signal to everyone watching that there’s a path here.
That signal matters more than most leaders admit. Only about a third of employees globally feel they have real opportunities to grow — and a stalled career is one of the most common reasons good people in India start looking elsewhere.
Performance distribution is the companion metric. If almost everyone is rated “meets expectations,” your ratings have stopped meaning anything, and your genuine high performers and quiet flight risks are both invisible. A performance curve you can actually trust is what lets the rest of the dashboard make sense.
This is where modern performance management software in India earns its place — turning appraisals from a once-a-year ritual into a live signal you can pair with attrition, engagement, and mobility.
Bringing it onto one screen
Notice what these eight metrics have in common. Attrition sits in one system. Attendance in another. Engagement in a survey tool. Performance in a spreadsheet somebody emails around. Payroll and compliance somewhere else entirely.
The dashboard isn’t hard because the metrics are complicated. It’s hard because the data lives in five disconnected places and nobody has made it talk.
That’s the real job of HR analytics software in India — not prettier charts, but a single connected layer where attendance, leave, payroll, performance, and headcount finally sit together. Once that foundation exists, workforce analytics stops being a quarterly fire drill and becomes something you can simply glance at.
ONE CONNECTED SOURCE OF TRUTH
Eight numbers. One screen.
Timelabs fits the Indian reality specifically — biometric and field attendance, payroll with statutory compliance built in, and performance management, all feeding one source of truth. The eight metrics above stop being a monthly assembly job and start being a live view of your workforce.
Explore the Timelabs HRMS → timelabs.in
The bottom line
Come back to that boardroom. The CFO’s question hasn’t changed — but now you have the folder that answers it, and the eight numbers inside it that connect your people strategy to the business.
That’s the shift. A CHRO who can walk in and say exactly what attrition is costing, why roles are staying open, and where the next risk is building doesn’t get treated as an overhead. They get treated as a partner.
You almost certainly already have the data. It’s sitting in your attendance logs, your payroll, your appraisals, your exit interviews. The only question is whether it’s on one screen — or scattered across five where nobody’s looking.
Pick your eight. Get them talking. Then walk into the next review with answers instead of activity reports.
Must Read: Managing 5,000+ Workers on One HR System: How India’s Largest Construction Companies Actually Do It
Frequently asked questions (FAQs)
Q1: What is a CHRO dashboard?
A: A single view of the handful of people metrics that show whether your talent strategy is working — attrition, time to hire, cost per hire, engagement, revenue per employee, and more. The goal isn’t to display everything; it’s to surface the few numbers that drive real decisions.
Q2: What are the most important HR metrics to track in India?
A: The eight on almost every dashboard: regrettable attrition, time to hire (plus the offer-to-start gap), cost per hire, offer acceptance rate, absenteeism, employee engagement/eNPS, revenue per employee, and internal mobility with performance distribution. Together, they cover the full lifecycle from hiring to retention to business value.
Q3: How often should a CHRO review these metrics?
A: It depends on the metric. Efficiency numbers (time to hire, absenteeism) suit a weekly or monthly look; quality and engagement metrics monthly; strategic ones like revenue per employee and internal mobility quarterly. The rhythm matters less than actually acting on what you see.
Q4: Do we need special HR analytics software to build a dashboard?
A: You can start with a simple tracking sheet, but the hard part is pulling data from disconnected systems every month. A modern HRMS that already holds attendance, payroll, and performance in one place makes the dashboard a live view instead of a manual assembly job — which is where HR analytics and workforce analytics software in India earn their keep.
Q5: What’s the difference between a leading and a lagging HR metric?
A: A lagging metric tells you what already happened — attrition is the classic example. A leading metric warns you what’s coming — engagement and absenteeism both tend to move before people actually leave. A good dashboard carries both so you’re not only reading history.
Q6: Which HR metrics are just vanity metrics?
A: Activity counts — job posts made, CVs received, interviews scheduled, messages sent — tell you how busy your team is, not whether hiring is producing business value. They’re fine for internal ops, but they don’t belong on a CHRO dashboard.